> ## Documentation Index
> Fetch the complete documentation index at: https://hoopdev-docs-improve-idp-sso-pages.mintlify.site/llms.txt
> Use this file to discover all available pages before exploring further.
# Parallel Mode
> Execute commands across multiple connections simultaneously
 This feature is currently in Beta. Update to the latest Hoop version to access it.
## What You'll Accomplish
Parallel Mode lets you run the same command across multiple connections at once. Instead of connecting to each server individually, you can:
* Restart services across multiple servers simultaneously
* Run the same query on multiple databases
* Execute maintenance scripts on all production hosts
* Check status across your entire infrastructure
***
## How It Works
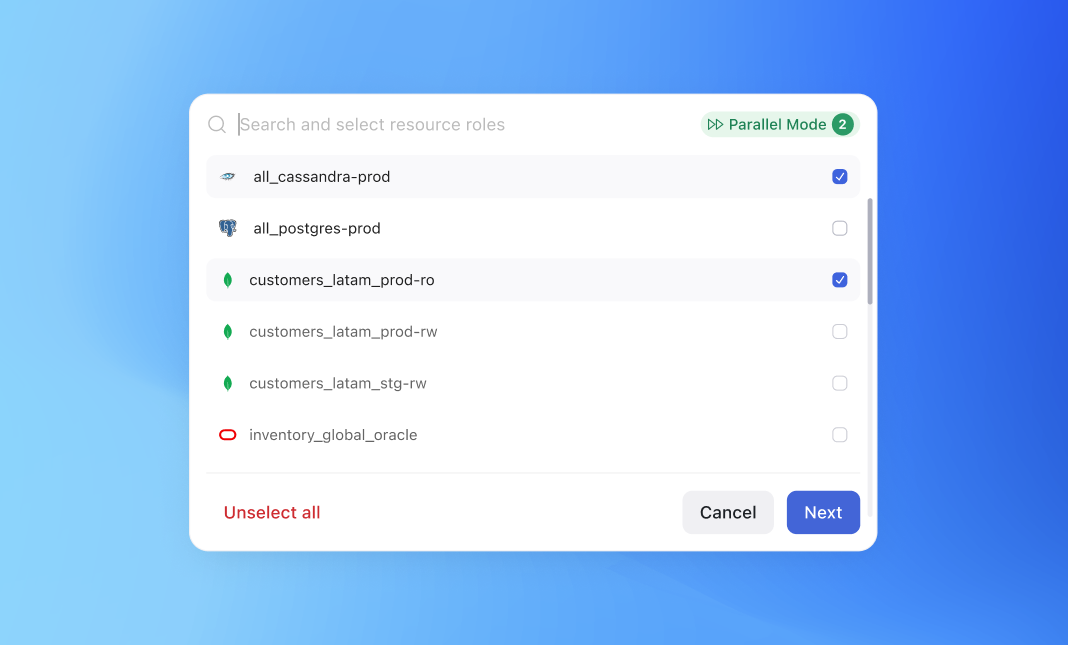
Choose multiple connections to run your command on
Type the command or query once
Hoop runs the command on all selected connections in parallel
See results from all connections in a unified view
***
## Quick Start
### Step 1: Open Parallel Mode
1. Go to the **Web Terminal** in the Hoop Web App
2. Click the **Parallel Mode** toggle in the top-right corner
### Step 2: Select Connections
1. Use the connection picker to select multiple connections
2. Filter by type, tags, or name to find connections quickly
3. Click connections to add them to your selection
### Step 3: Run a Command
1. Type your command in the input field
2. Click **Execute** or press Enter
3. Watch results stream in from all connections
### Step 4: Review Results
The Execution Summary shows:
* **Success** - Command completed successfully
* **Error** - Command failed (click to see details)
* **Approval Required** - Waiting for access request approval
***
## Use Cases
### 1. Service Restarts
Restart a service across all application servers:
```bash theme={null}
sudo systemctl restart myapp
```
Select all `app-server-*` connections and execute once.
### 2. Database Health Checks
Check replication status on all database replicas:
```sql theme={null}
SELECT pg_is_in_recovery(), pg_last_wal_receive_lsn();
```
Run on `db-replica-1`, `db-replica-2`, `db-replica-3` simultaneously.
### 3. Configuration Updates
Update a configuration file on multiple hosts:
```bash theme={null}
sed -i 's/old_value/new_value/g' /etc/myapp/config.yaml
```
### 4. Log Collection
Check recent errors across all servers:
```bash theme={null}
tail -100 /var/log/myapp/error.log | grep ERROR
```
### 5. Kubernetes Operations
Scale deployments across multiple clusters:
```bash theme={null}
kubectl scale deployment myapp --replicas=5
```
Run on connections for each Kubernetes cluster.
***
## Working with Results
### Execution Summary
The summary panel shows the status of each connection:
| Status | Icon | Meaning |
| ---------------- | ----------- | ------------------------------ |
| Success | Green check | Command completed successfully |
| Error | Red X | Command failed |
| Running | Spinner | Command in progress |
| Pending Approval | Clock | Waiting for access request |
### Viewing Output
Click on any connection in the summary to see its full output:
* **stdout** - Standard output from the command
* **stderr** - Error output (if any)
* **Exit code** - Command exit status
### Comparing Results
Results are displayed side-by-side, making it easy to:
* Spot differences between servers
* Identify which servers have issues
* Verify consistent state across infrastructure
***
## Filtering and Selection
### Filter by Type
Select connections by resource type:
* Databases
* Servers
* Kubernetes clusters
* Applications
### Filter by Tags
Use tags to group related connections:
* `environment:production`
* `region:us-east`
* `team:platform`
### Search
Type to search connections by name.
### Select All Matching
After filtering, click **Select All** to add all visible connections.
***
## Access Requests in Parallel Mode
If connections require access request approval:
1. **JIT Access Requests:** You'll be prompted to request access for each connection that requires it
2. **Action Access Requests:** Each command submission creates approval requests
3. **Mixed:** Some connections may execute immediately while others wait for approval
The Execution Summary shows which connections are waiting for approval.
***
## Runbooks in Parallel Mode
You can also run Runbooks across multiple connections:
1. Open **Runbooks** in the sidebar
2. Select a runbook
3. Enable **Parallel Mode**
4. Select target connections
5. Fill in runbook parameters
6. Execute
All connections receive the same parameter values.
***
## Best Practices
Run commands on one connection before scaling to many
Tag connections for easy group selection
Begin with a few connections, then expand
Check all results, not just the first one
### Safety Tips
1. **Dry run first:** If your command supports it (e.g., `--dry-run`), test before executing
2. **Limit scope:** Don't select all connections unless you're sure
3. **Check the list:** Review selected connections before executing
4. **Monitor results:** Watch for failures as they occur
***
## Troubleshooting
### Some Connections Fail
If some connections succeed but others fail:
1. Click the failed connection to see the error
2. Common causes:
* Connection is offline
* Different OS or command not available
* Permission issues on that specific host
3. Fix the issue and re-run on just the failed connections
### Command Timeout
Long-running commands may timeout:
1. Check the command on a single connection first
2. Consider breaking into smaller operations
3. For very long operations, use a runbook with proper timeout settings
### Access Request Delays
If approvals are slow:
1. Check that approvers are online
2. Verify Slack/Teams notifications are working
3. Consider pre-requesting access before running parallel commands
***
## Limitations
Current beta limitations:
| Limitation | Details |
| ------------------- | ------------------------------------- |
| Maximum connections | 50 connections per parallel execution |
| Command size | 64KB maximum command length |
| Result size | 1MB maximum output per connection |
| Timeout | 5 minutes default per connection |
***
## Next Steps
Create reusable command templates
Configure approval workflows
Audit parallel executions
Explore the Web Terminal
This feature is currently in Beta. Update to the latest Hoop version to access it.
## What You'll Accomplish
Parallel Mode lets you run the same command across multiple connections at once. Instead of connecting to each server individually, you can:
* Restart services across multiple servers simultaneously
* Run the same query on multiple databases
* Execute maintenance scripts on all production hosts
* Check status across your entire infrastructure
***
## How It Works
Choose multiple connections to run your command on
Type the command or query once
Hoop runs the command on all selected connections in parallel
See results from all connections in a unified view
***
## Quick Start
### Step 1: Open Parallel Mode
1. Go to the **Web Terminal** in the Hoop Web App
2. Click the **Parallel Mode** toggle in the top-right corner
### Step 2: Select Connections
1. Use the connection picker to select multiple connections
2. Filter by type, tags, or name to find connections quickly
3. Click connections to add them to your selection
### Step 3: Run a Command
1. Type your command in the input field
2. Click **Execute** or press Enter
3. Watch results stream in from all connections
### Step 4: Review Results
The Execution Summary shows:
* **Success** - Command completed successfully
* **Error** - Command failed (click to see details)
* **Approval Required** - Waiting for access request approval
***
## Use Cases
### 1. Service Restarts
Restart a service across all application servers:
```bash theme={null}
sudo systemctl restart myapp
```
Select all `app-server-*` connections and execute once.
### 2. Database Health Checks
Check replication status on all database replicas:
```sql theme={null}
SELECT pg_is_in_recovery(), pg_last_wal_receive_lsn();
```
Run on `db-replica-1`, `db-replica-2`, `db-replica-3` simultaneously.
### 3. Configuration Updates
Update a configuration file on multiple hosts:
```bash theme={null}
sed -i 's/old_value/new_value/g' /etc/myapp/config.yaml
```
### 4. Log Collection
Check recent errors across all servers:
```bash theme={null}
tail -100 /var/log/myapp/error.log | grep ERROR
```
### 5. Kubernetes Operations
Scale deployments across multiple clusters:
```bash theme={null}
kubectl scale deployment myapp --replicas=5
```
Run on connections for each Kubernetes cluster.
***
## Working with Results
### Execution Summary
The summary panel shows the status of each connection:
| Status | Icon | Meaning |
| ---------------- | ----------- | ------------------------------ |
| Success | Green check | Command completed successfully |
| Error | Red X | Command failed |
| Running | Spinner | Command in progress |
| Pending Approval | Clock | Waiting for access request |
### Viewing Output
Click on any connection in the summary to see its full output:
* **stdout** - Standard output from the command
* **stderr** - Error output (if any)
* **Exit code** - Command exit status
### Comparing Results
Results are displayed side-by-side, making it easy to:
* Spot differences between servers
* Identify which servers have issues
* Verify consistent state across infrastructure
***
## Filtering and Selection
### Filter by Type
Select connections by resource type:
* Databases
* Servers
* Kubernetes clusters
* Applications
### Filter by Tags
Use tags to group related connections:
* `environment:production`
* `region:us-east`
* `team:platform`
### Search
Type to search connections by name.
### Select All Matching
After filtering, click **Select All** to add all visible connections.
***
## Access Requests in Parallel Mode
If connections require access request approval:
1. **JIT Access Requests:** You'll be prompted to request access for each connection that requires it
2. **Action Access Requests:** Each command submission creates approval requests
3. **Mixed:** Some connections may execute immediately while others wait for approval
The Execution Summary shows which connections are waiting for approval.
***
## Runbooks in Parallel Mode
You can also run Runbooks across multiple connections:
1. Open **Runbooks** in the sidebar
2. Select a runbook
3. Enable **Parallel Mode**
4. Select target connections
5. Fill in runbook parameters
6. Execute
All connections receive the same parameter values.
***
## Best Practices
Run commands on one connection before scaling to many
Tag connections for easy group selection
Begin with a few connections, then expand
Check all results, not just the first one
### Safety Tips
1. **Dry run first:** If your command supports it (e.g., `--dry-run`), test before executing
2. **Limit scope:** Don't select all connections unless you're sure
3. **Check the list:** Review selected connections before executing
4. **Monitor results:** Watch for failures as they occur
***
## Troubleshooting
### Some Connections Fail
If some connections succeed but others fail:
1. Click the failed connection to see the error
2. Common causes:
* Connection is offline
* Different OS or command not available
* Permission issues on that specific host
3. Fix the issue and re-run on just the failed connections
### Command Timeout
Long-running commands may timeout:
1. Check the command on a single connection first
2. Consider breaking into smaller operations
3. For very long operations, use a runbook with proper timeout settings
### Access Request Delays
If approvals are slow:
1. Check that approvers are online
2. Verify Slack/Teams notifications are working
3. Consider pre-requesting access before running parallel commands
***
## Limitations
Current beta limitations:
| Limitation | Details |
| ------------------- | ------------------------------------- |
| Maximum connections | 50 connections per parallel execution |
| Command size | 64KB maximum command length |
| Result size | 1MB maximum output per connection |
| Timeout | 5 minutes default per connection |
***
## Next Steps
Create reusable command templates
Configure approval workflows
Audit parallel executions
Explore the Web Terminal